Gene Search:
Gene search feature allows user to search the database with specific gene.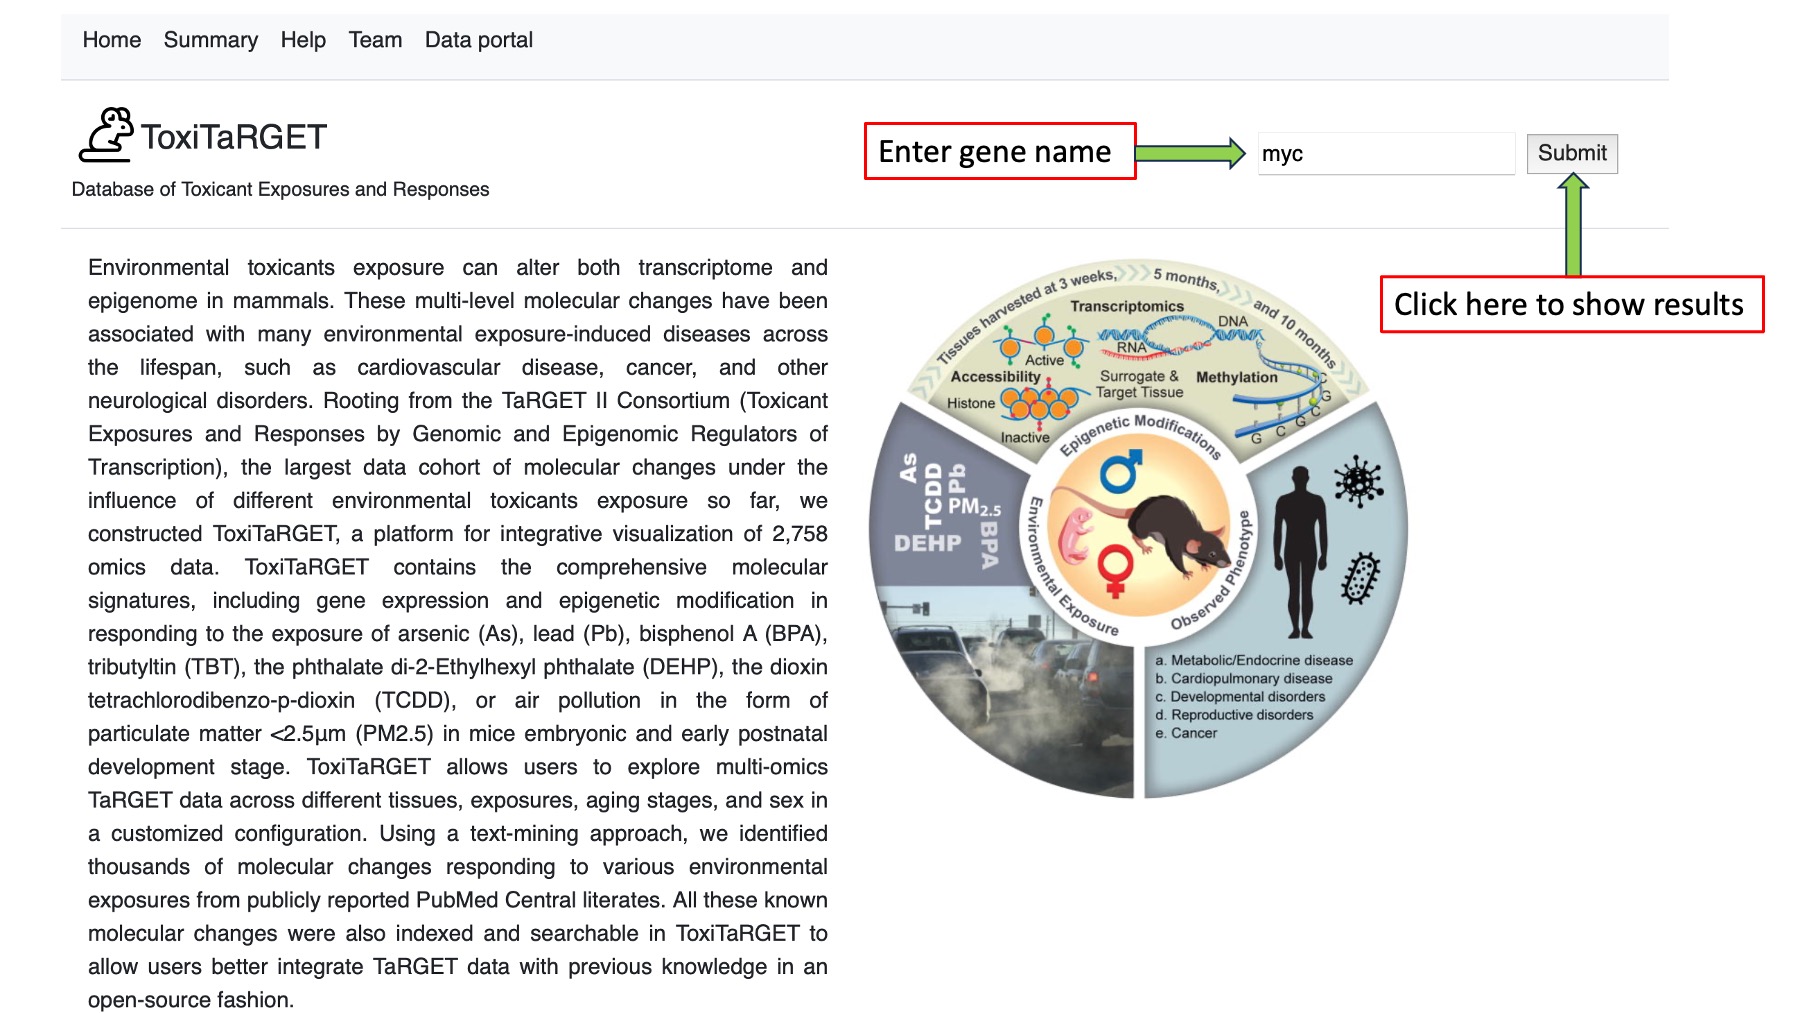
After clicking the submit button, it give four different types of output. (1) Gene summary, (2) Output from gene expression data (RNA-Seq data), (3) Output from open chromatin region (ATAC-Seq data), (4) Output from DNA methylation (WGBS and RRBS data) as shown the figure below.
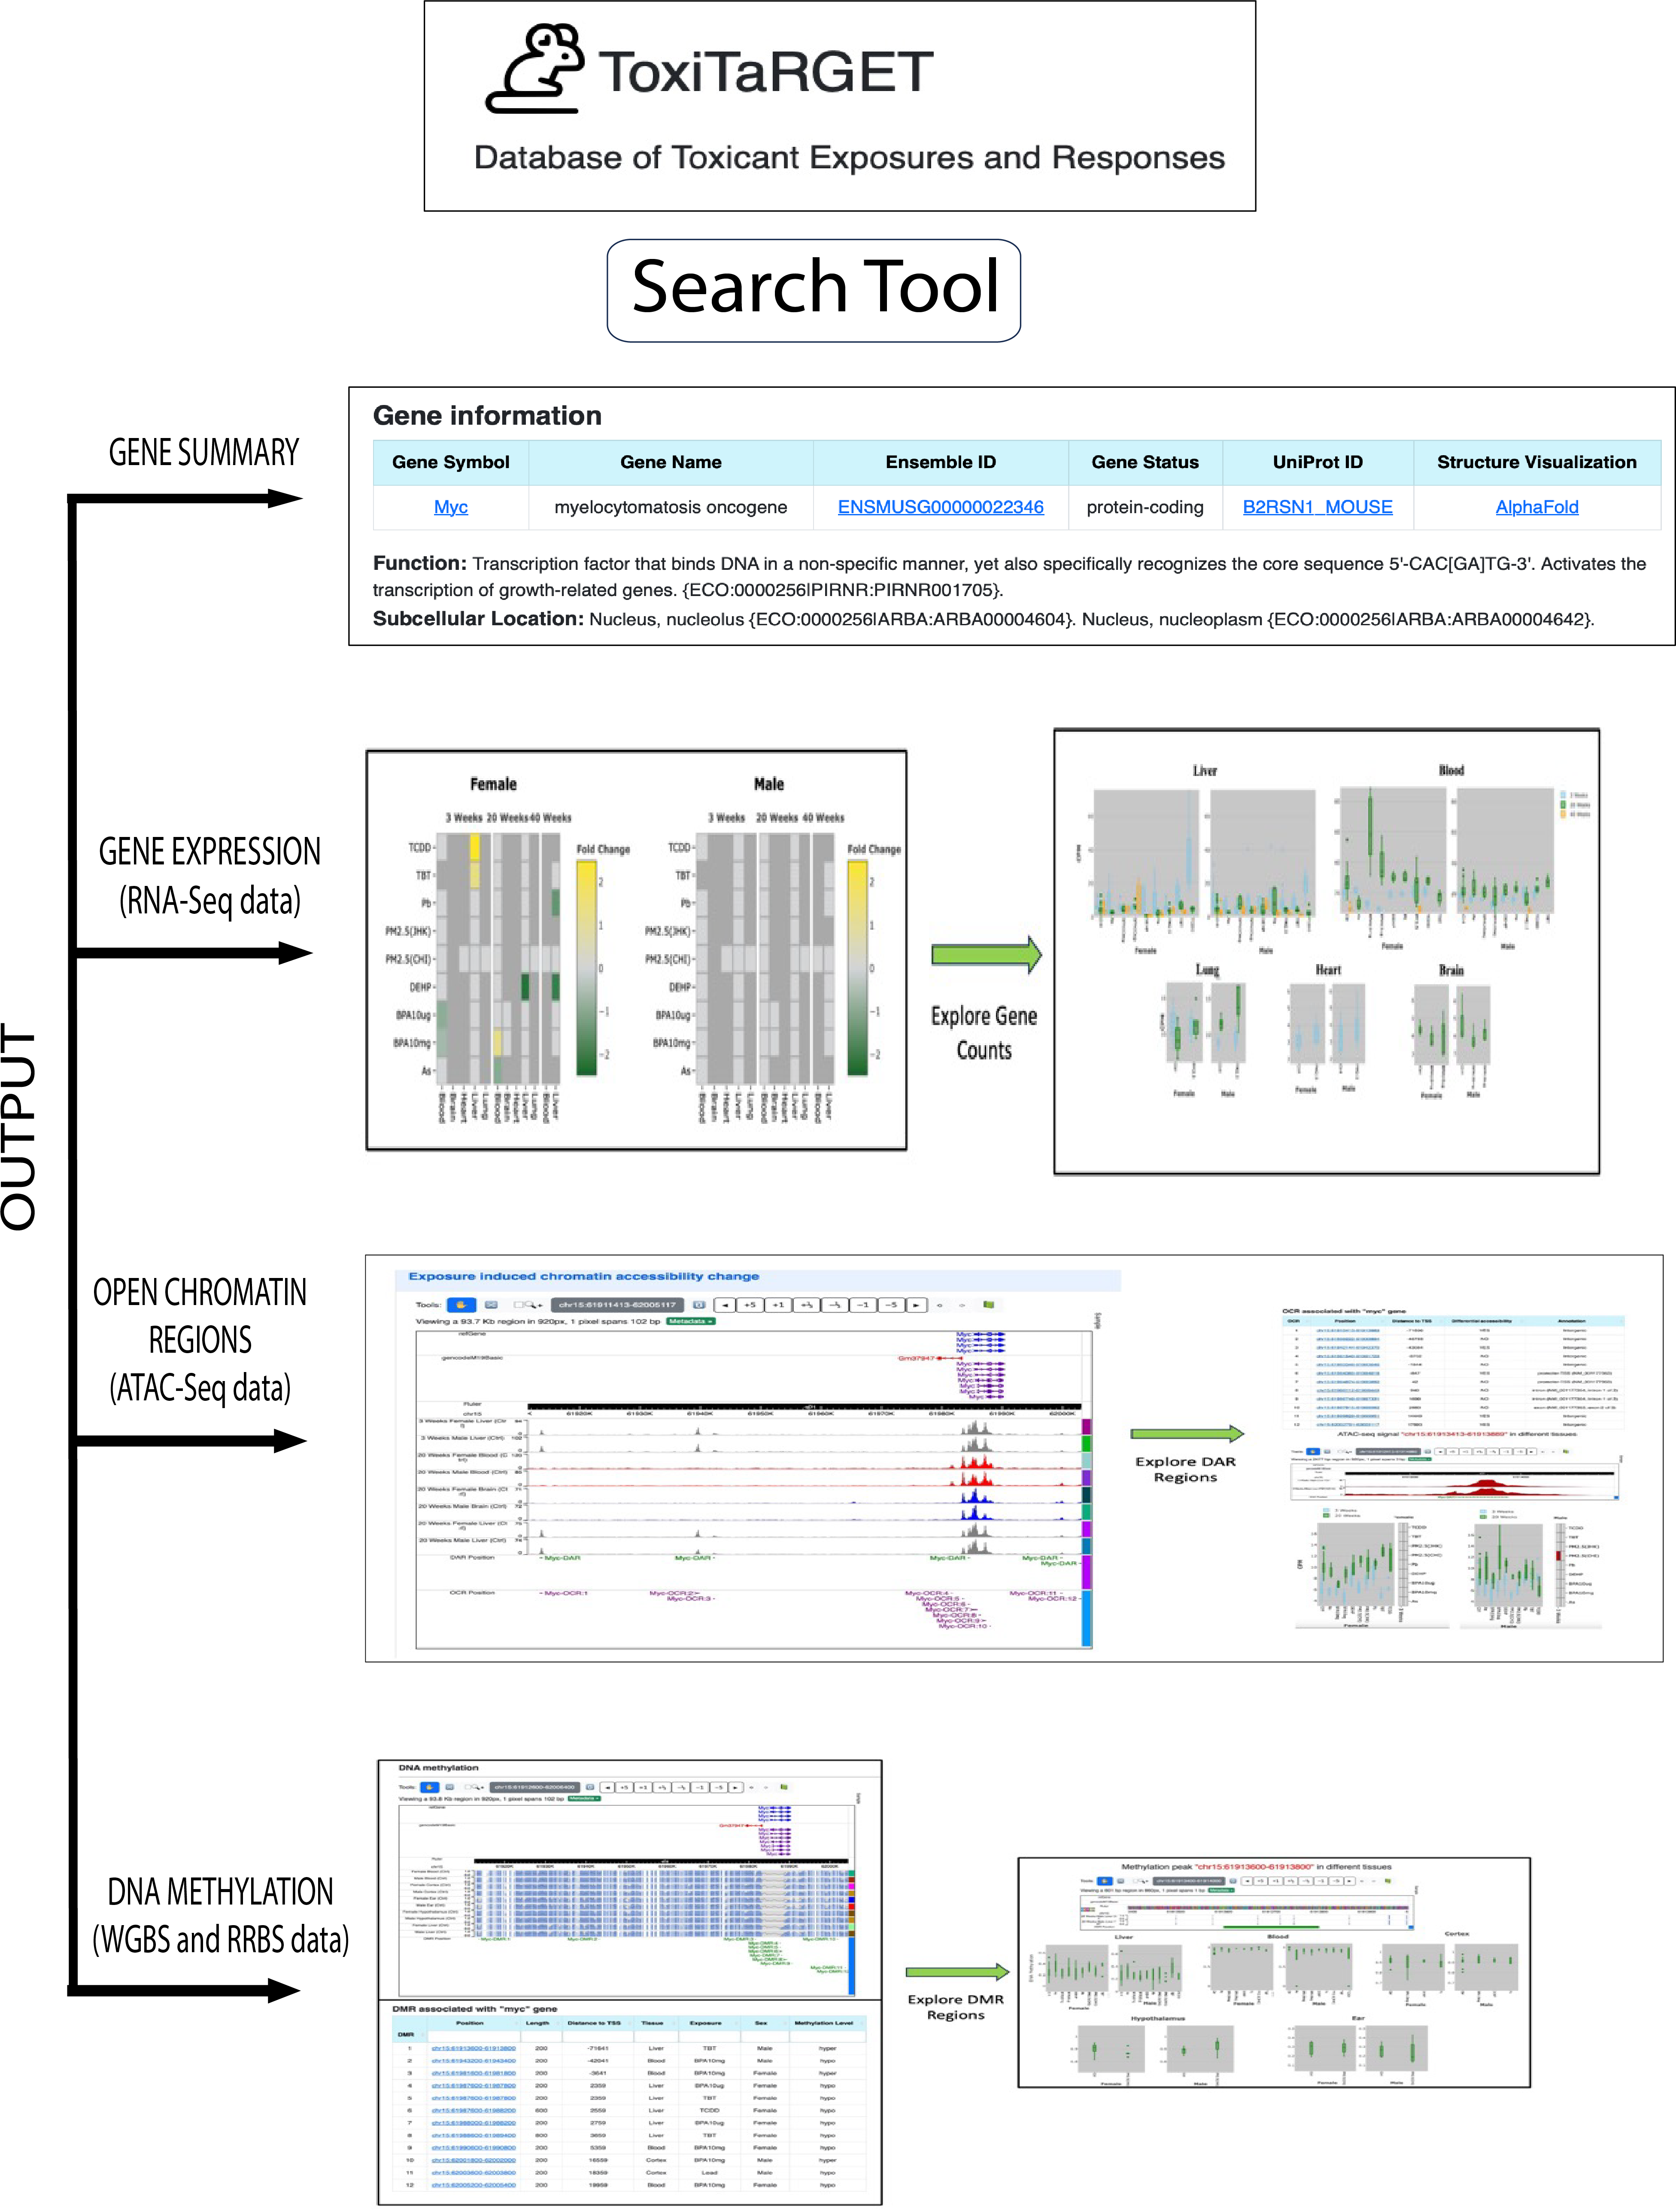
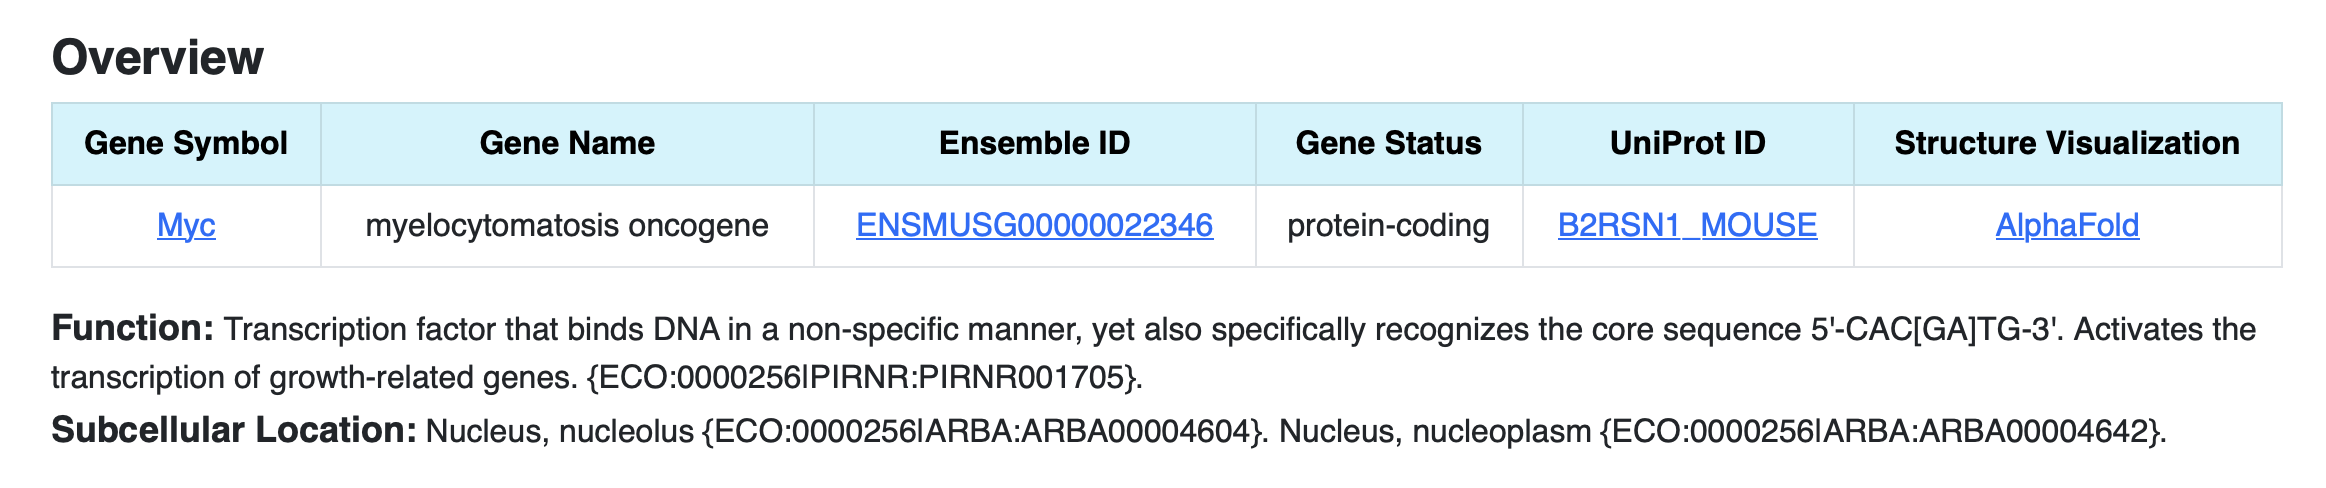
1. Gene SummaryThis section gives gene information such as ensemble ID, uniport ID, gene status, structure visualization through alpha fold, function, and subcellular location of the gene as shown in the figure.
2. Expression data
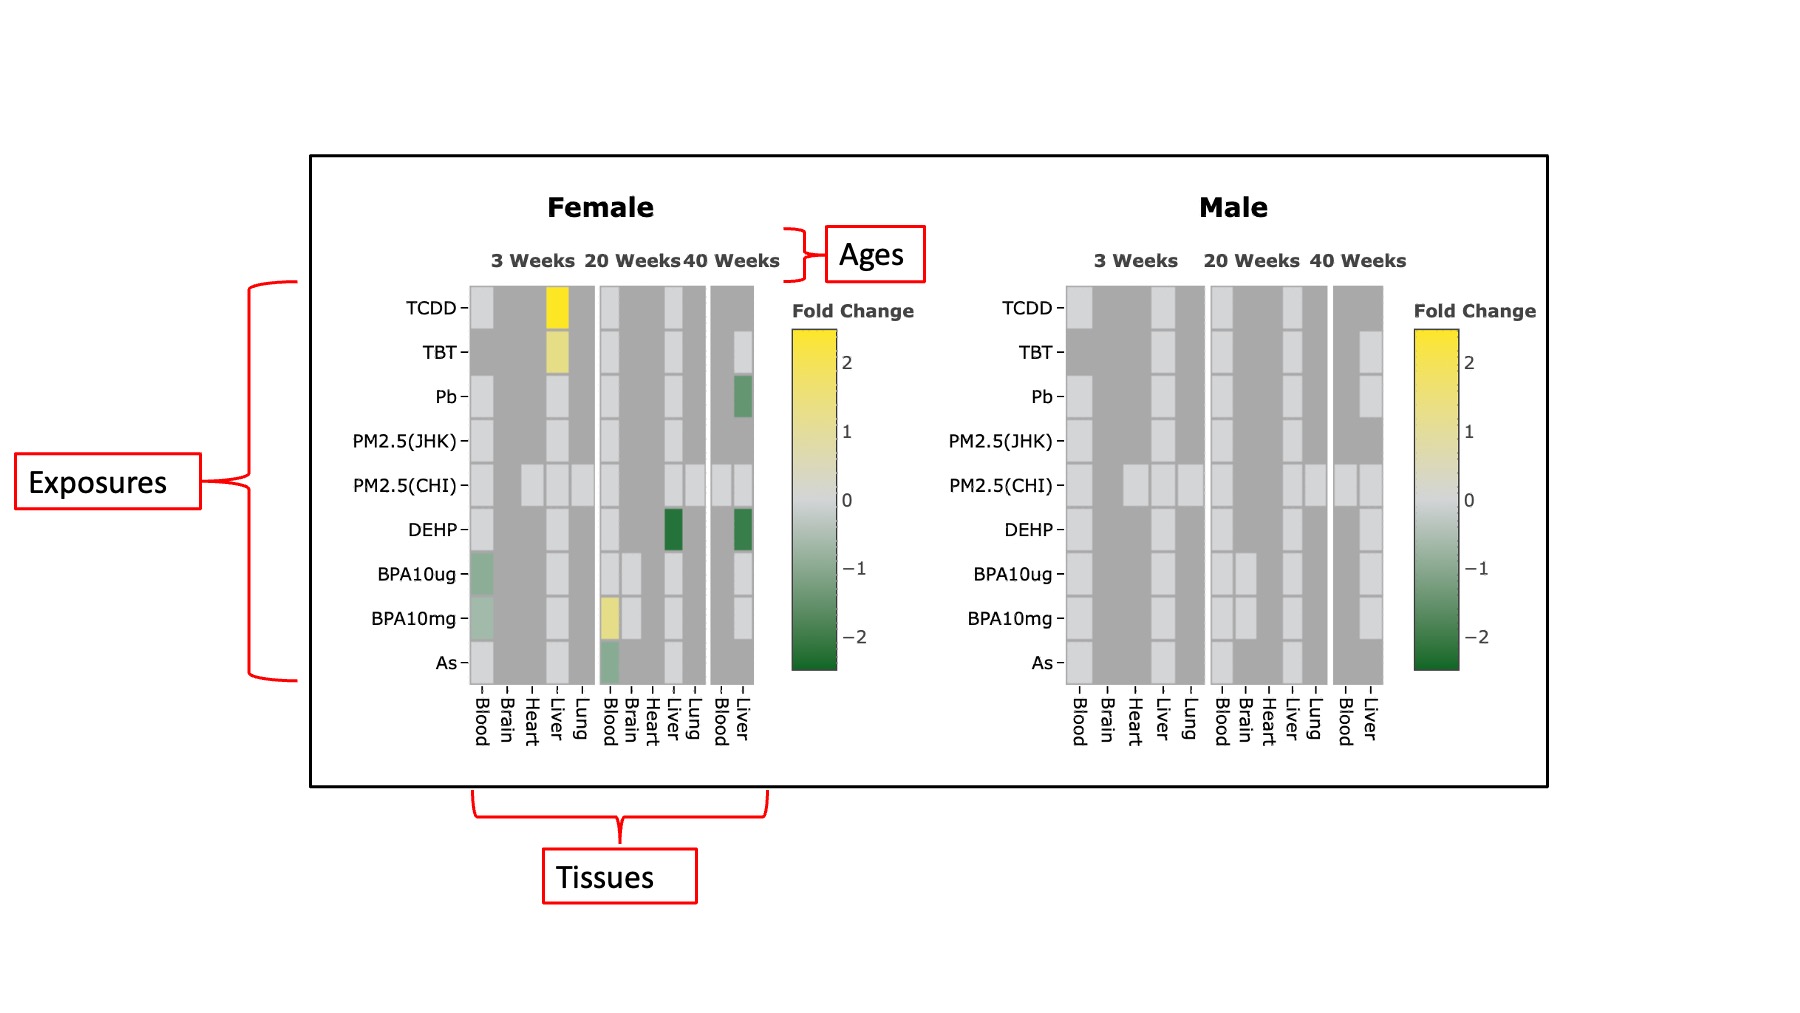
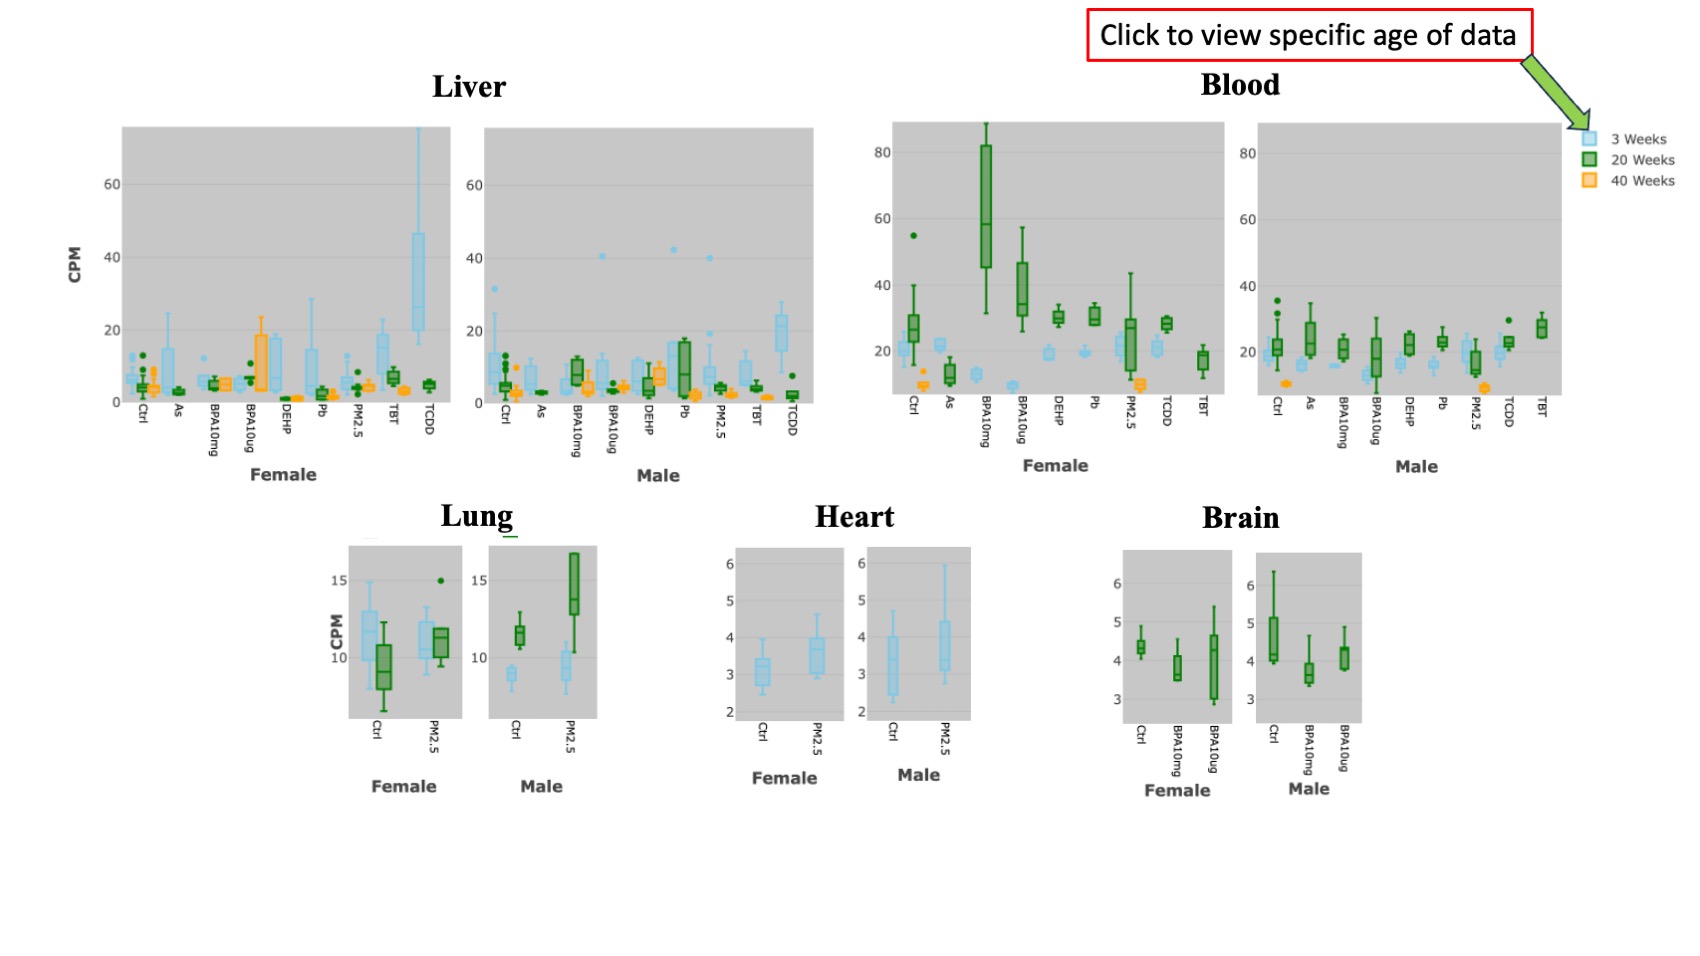
The second section is derived from the RNA-Seq results, and it is further divided into two sub-sections. The first sub-section provides information on whether the queried gene is differentially expressed or non-differentially expressed under various exposures across different tissues and sexes. This information is visually presented through two heatmap. Each heatmap represents a specific sex, and both heatmaps incorporate data from all three age groups. The X-axis displays tissues and age, while the Y-axis illustrates exposures. Different colors indicate up and down-regulated Differentially Expressed Genes (DEGs).The second sub-section displays the expression pattern of the queried gene in diverse tissues under varying exposures, relative to the control, using a box plot format. For each sex, every tissue features two box plots, encompassing all three age groups of mice. Different colors represent different ages. Users can choose to analyze a single age or all ages simultaneously by utilizing the toggle button conveniently located at the top right of each plot.
3. Chromatin Accessibility
The third section provides chromatin accessibility information derived from ATAC-Seq results, featuring two sub-sections. In the first sub-section, we have integrated the WashU genome browser, allowing users to access browser tracks for control conditions across all experimental scenarios, open chromatin regions (OCR), and differentially accessible regions (DAR). Clicking on specific OCR or DAR regions within the browser enables users to view the genomic region and conditions under which these regions are identified as OCR/DAR. The second sub-section presents a tabular compilation of all OCR and DAR associated with the queried gene. The OCRs are listed in decreasing order based on their distance from the transcription start site (TSS). We have incorporated sorting options for each column, providing users the flexibility to arrange data according to their preferences. Each OCR in the table is hyperlinked to a dedicated page for in-depth analysis.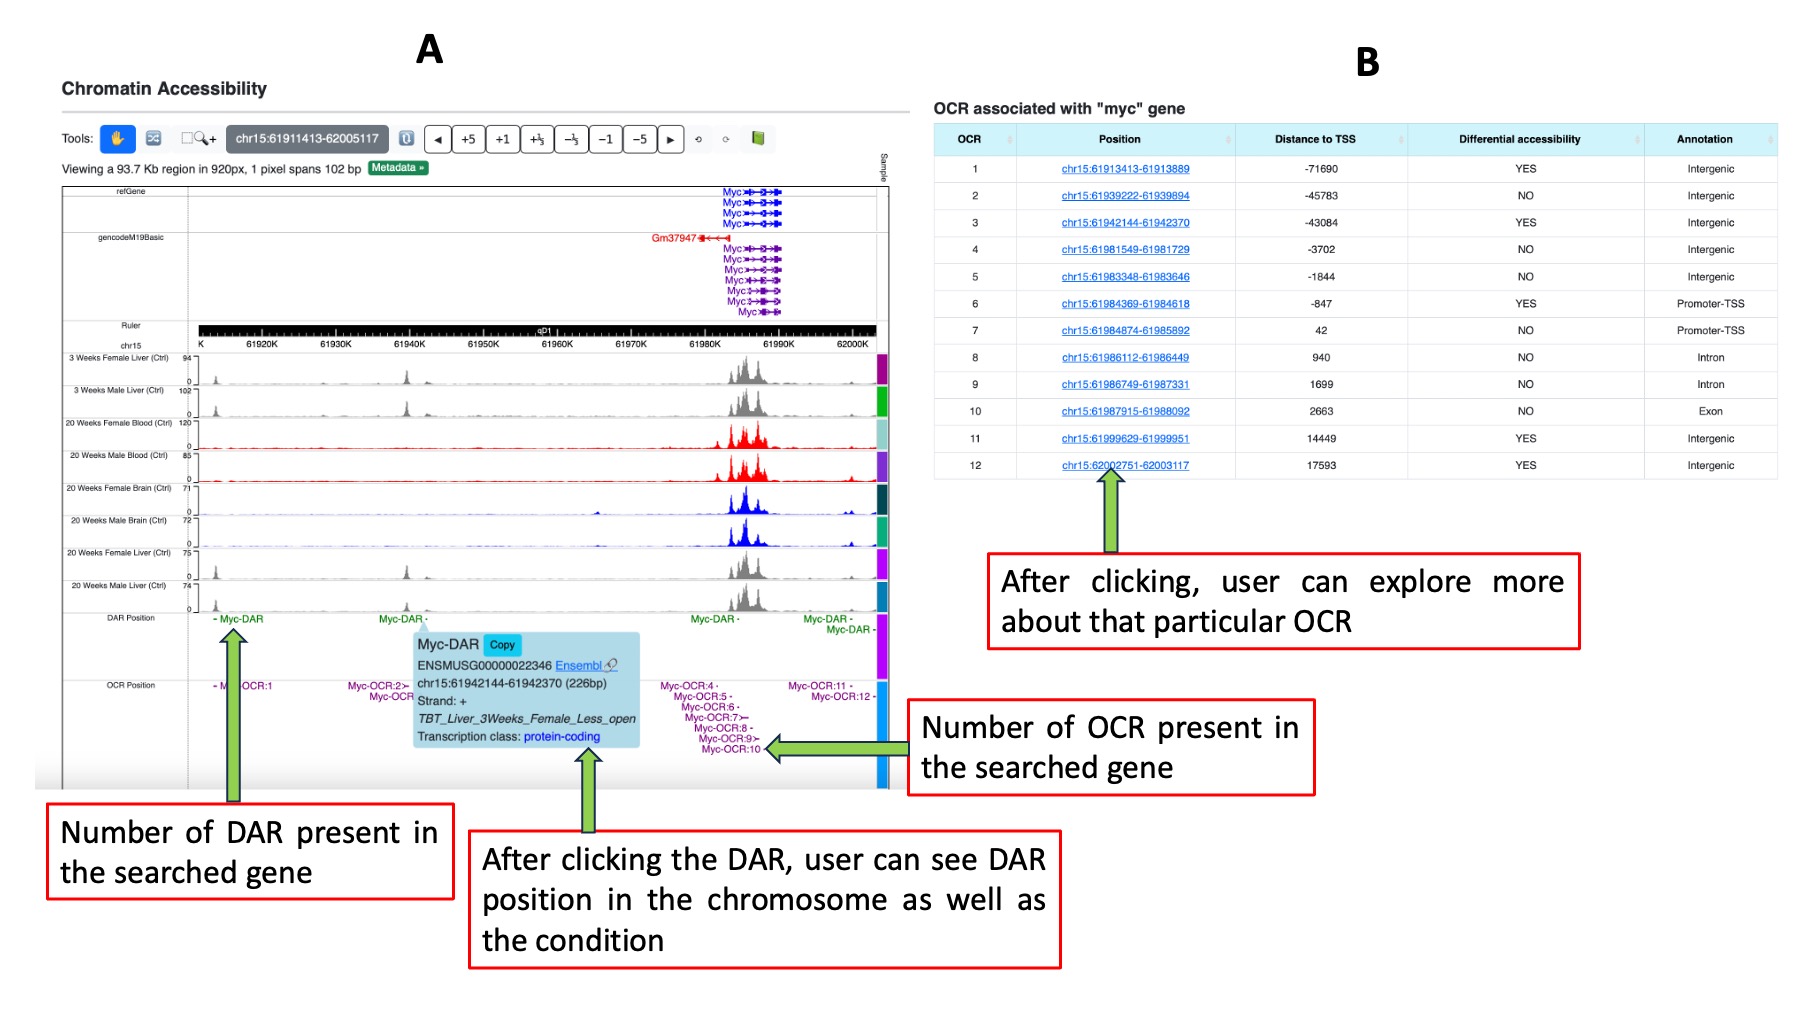
Figure 5. Chromatin accessibility results. Figure A shows OCR and DAR position in the chromosome in WashU epigenome browser. Figure B represents number of OCR present in searched gene in a tabular form.
Each OCR in the table is hyperlinked to a dedicated page for in-depth analysis. This page comprises three sub-sections. The first sub-section features a WashU browser displaying control and exposure tracks for easy visual comparison. It also indicates whether the OCR is differentially expressed, with the differential expression highlighted in green. Clicking on a DAR allows users to identify the gene name and its chromosomal location. The second sub-section consists of two heatmaps for each tissue and sex, illustrating whether the queried OCR is differentially expressed. Differential expression is represented by distinct colors, with the X-axis denoting age and the Y-axis indicating various exposures. The third sub-section includes two box plots for each tissue and sex, portraying OCR expression in different-aged tissues under varying exposures. This box plot closely resembles the one presented in the RNA-seq data section, providing users with a familiar visualization format.
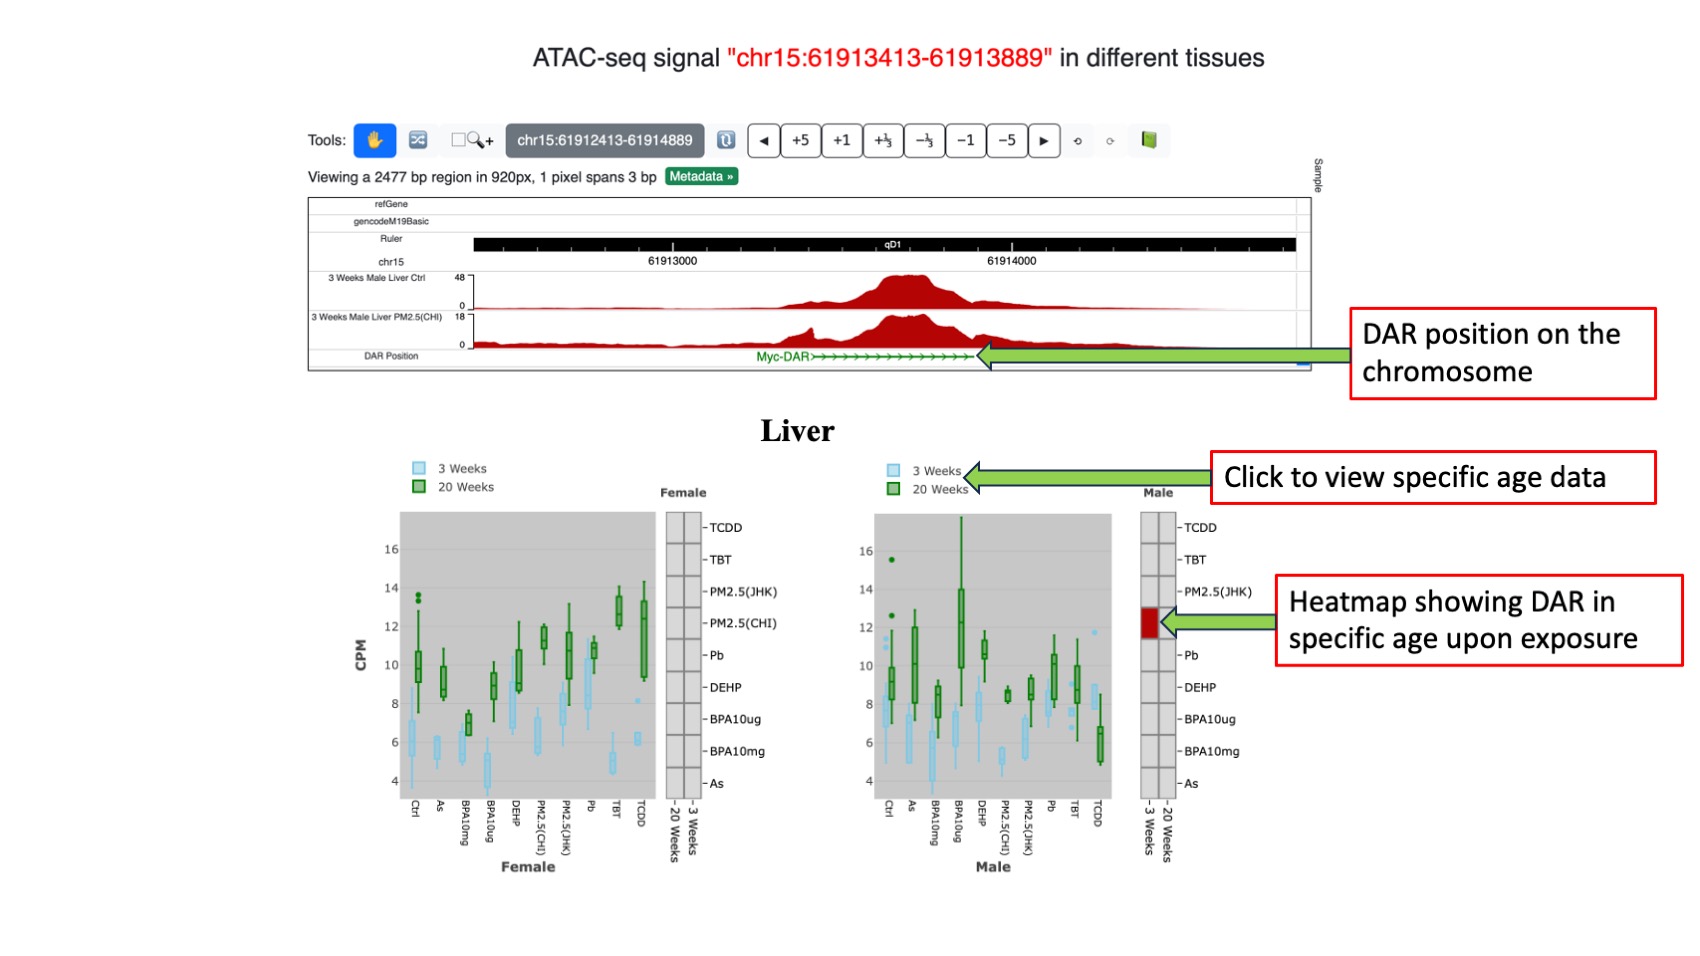
Figure 6. Upper figure shows control and specific exposure tracks where DAR present in WashU epigenome browser. Lower figure presents box plot and heatmap of each tissue of both the sex.
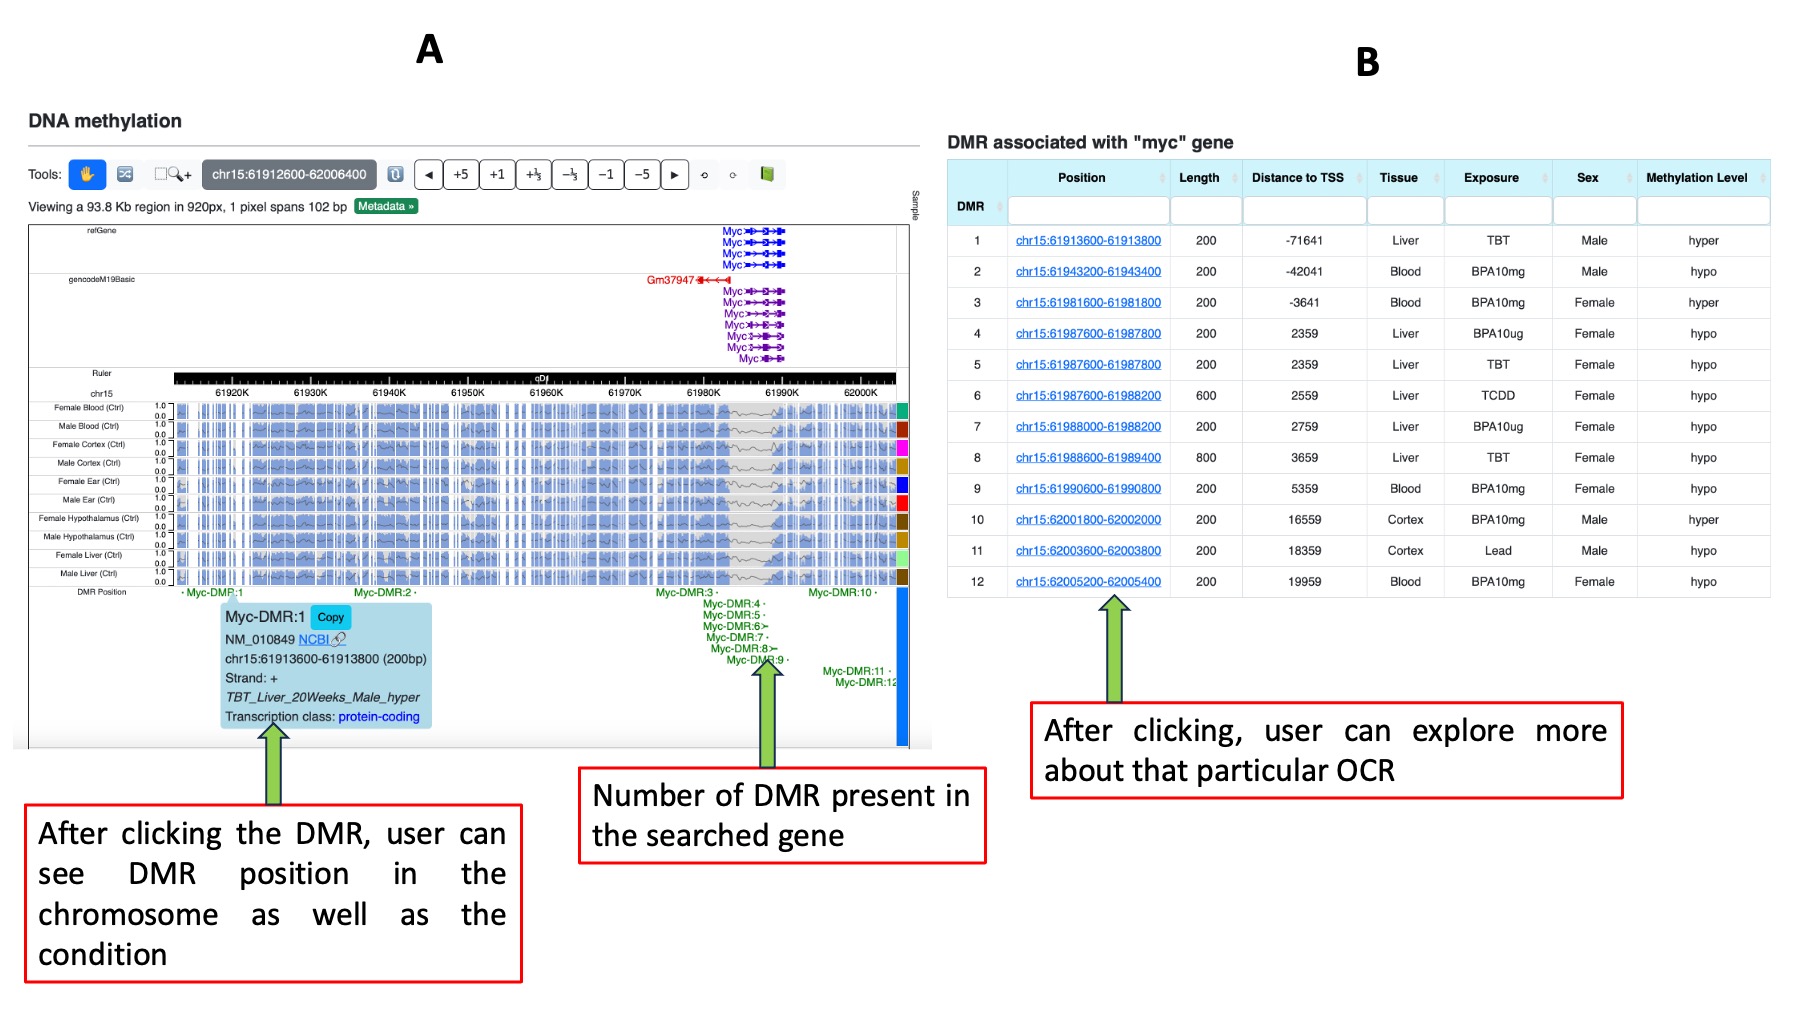
4. DNA methylation
The fourth and final section presents results from DNA methylation data. Clicking on "Explore DNA methylation pattern" redirects users to a separate page featuring two subsections. In the first subsection, a WashU browser displays control tracks for each tissue and sex, along with differentially methylated regions (DMR) annotated with gene names. Clicking on a DMR provides detailed information on its location in the chromosome, along with exposure, tissue, age, sex, and hypo- or hyper-methylation status associated with the queried gene. Each DMR shown in the browser is listed in decreasing order of proximity to the TSS and is denoted by a unique number (e.g., X-DMR:1, X-DMR:2, X-DMR:3 for a gene X with three DMRs). The second subsection presents a table enumerating the DMRs associated with the queried gene. The default order is decreasing by proximity to the TSS. The table includes information about DMR position, distance to TSS, tissue, sex, exposure, and methylation level in separate columns. Sorting and search options are available for user convenience.